SOP: Calculating the Most Probable Number of Growth Units for Hydrophobic Grid-Membrane Filter (HGMF) Methods
GIFSQ — Global Institute for Food Safety & Quality
1. Principle
The grid-lines of a hydrophobic grid-membrane filter (HGMF) are a hydrophobic print that divides the membrane into discrete growth compartments (grid-cells). The HGMF is treated as a multiple-tube Most Probable Number (MPN) procedure. The filter is inoculated by passing a sample suspension through the membrane, which spreads the organisms evenly and confines their growth inside the grid-cells; the grid array stops colonies from spreading sideways across the membrane.
Membrane filtration removes unwanted solutes or inhibitors from the test portion and improves the limit of detection through the concentration effect. Because the membrane can be moved from one growth medium to another, preliminary resuscitation and other biochemical tests can be run from the same membrane inoculation.
The HGMF can count suspensions holding up to 5,000 organisms/mL, so one dilution covers a wide range of contamination levels. Counting precision may be better than on conventional membrane filters because the HGMF reduces the effect of individual visual acuity on the count.
2. Apparatus required
- Hydrophobic grid-membrane filters (usually 1600 grid-cells per filter)
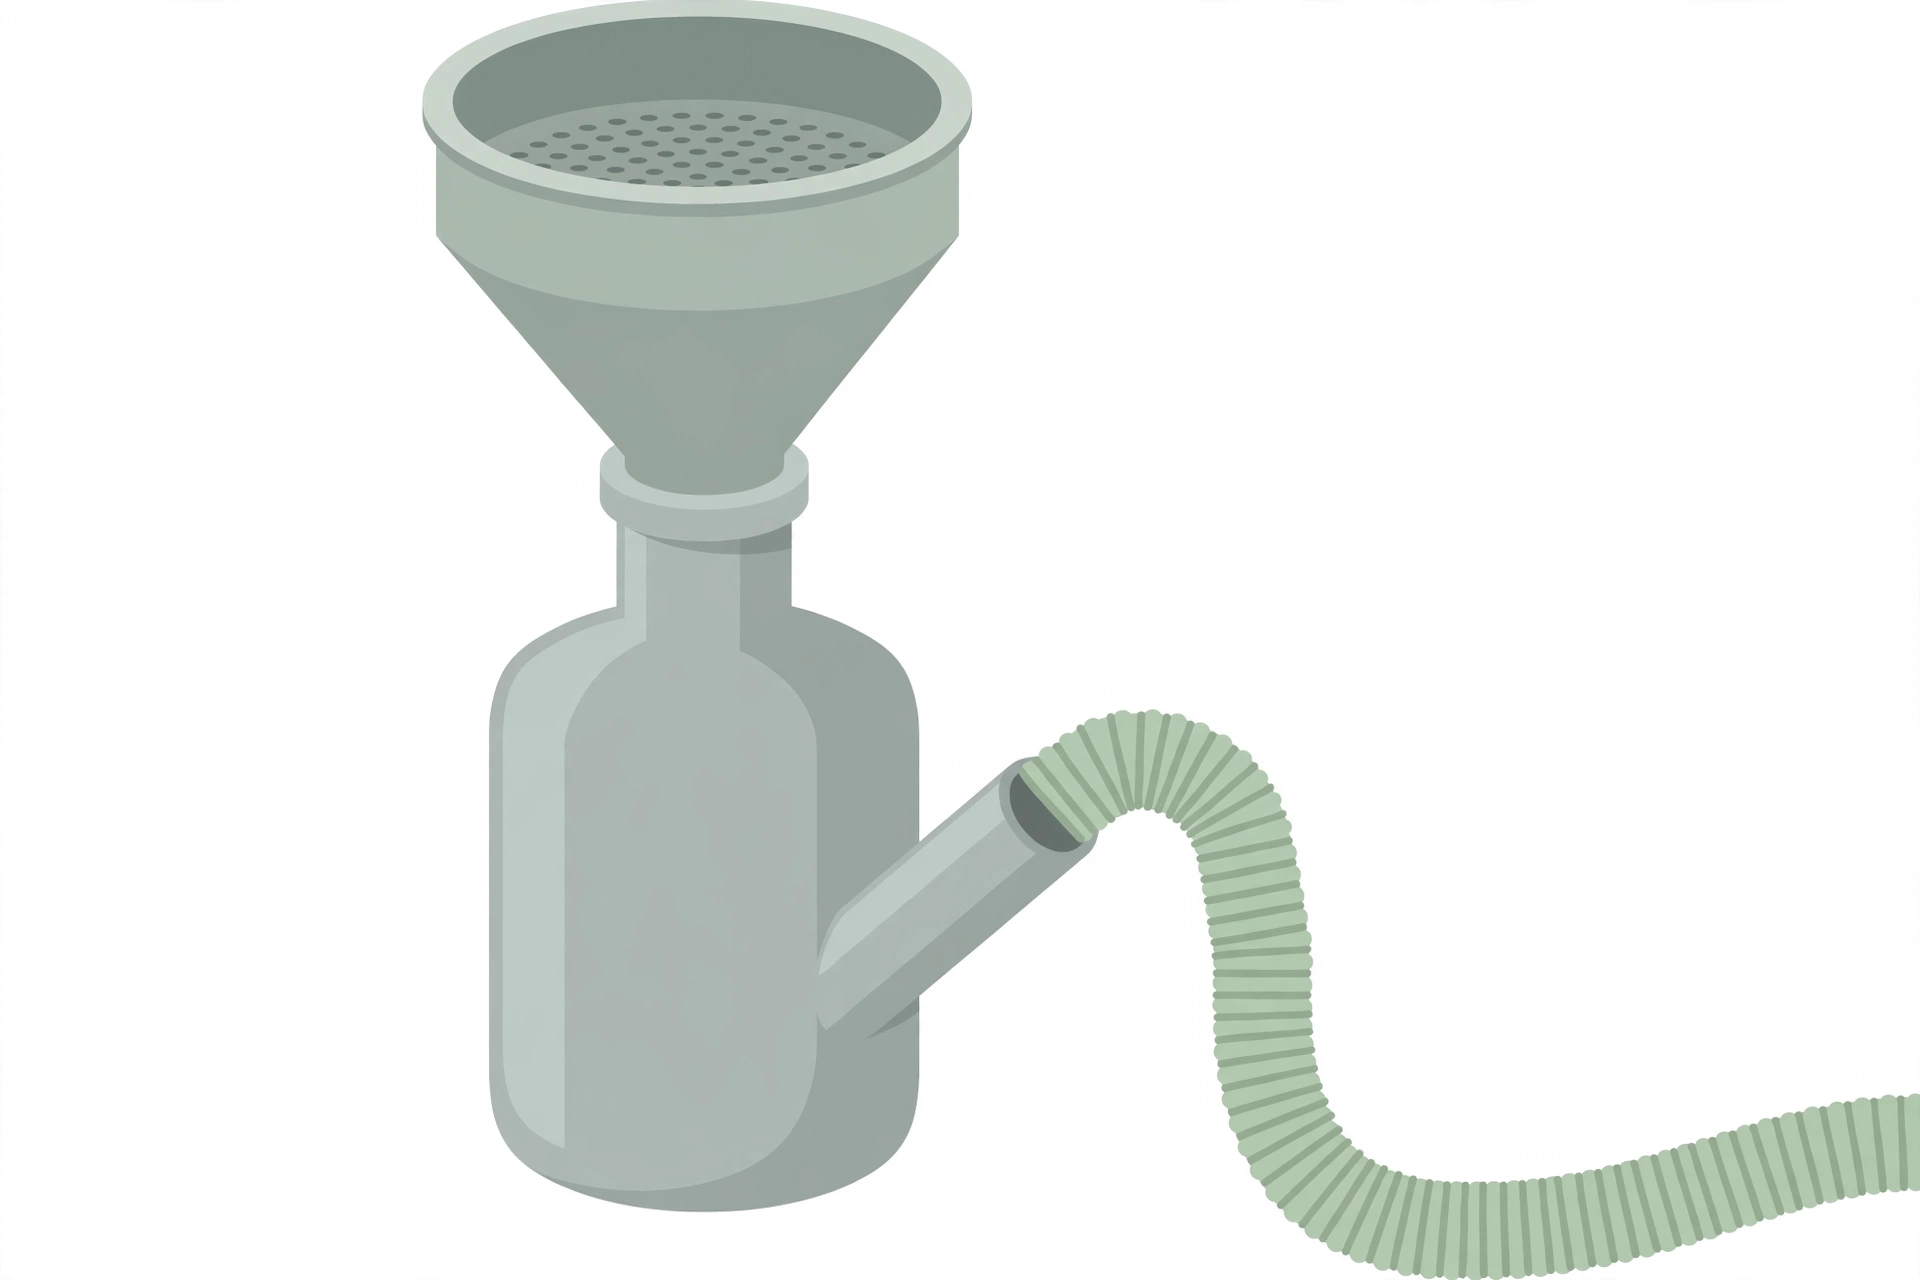
- Filtration apparatus
- Counting aid
3. Procedure
Score the HGMF growth:
- Count only HGMFs holding 20–1520 occupied grid-cells; counts outside this range are treated as estimates because of greater uncertainty
↓
- Score each grid-cell showing typical growth as one; do NOT count individual colonies when a grid-cell holds more than one typical colony; when a rough estimate shows fewer than 200 occupied grid-cells, count the whole HGMF
↓
- At higher densities (up to 50% of the grid-cells showing typical growth): rotate the HGMF so the centre indicator lies to the left or right; count positive grid-cells in the 4 rows immediately below and the 4 rows immediately above the centre (8 rows = one-fifth of the HGMF); multiply this partial count by 5 to obtain the score
↓
- When it is more practical to count negative grid-cells (no growth or non-typical growth): count all of them when there are fewer than 200; when the rough estimate is over 200, count as for positives (8 rows × 5); subtract the negative count from 1600 or 320, depending on whether the whole or one-fifth of the HGMF was counted; multiply by 5 when only one-fifth was counted
↓
Convert the scores to MPN values:
- For each of the duplicate HGMF scores, calculate (or look up in the Conversion Table) the matching MPNGU value
↓
- Calculate the MPNGU for each filter, then take the average; do NOT average the scores of the duplicate filters before calculating the average MPNGU
↓
- When 1.0 mL of a 1 in 10 suspension was used to inoculate the HGMF, multiply the average MPNGU by 10 to get organisms per g (mL) of product
↓
- When V mL of the 1 in 10 suspension was used, multiply the average MPNGU by 10/V
↓
- When V mL of a 1 in C (concentration) dilution was used, multiply the average MPNGU by C/V
↓
Report the results:
- Report the average MPNGU, rounded to two significant figures (e.g., record 2881 as 2900)
↓
- When the lowest dilution plated shows no positive grid-cells (no growth or non-typical growth), record the lowest average obtainable with that volume plated onto replicate HGMFs, preceded by a “less than” (<) sign (e.g., for 1.0 mL on duplicate HGMFs the value is < 0.5); multiply this figure by the dilution factor of the inoculum on the HGMF
↓
- Report as ≥ 11804 when all grid-cells show typical growth
4. Calculation
MPNGU = N logₑ(N/(N − x))
Where,
- MPNGU = most probable number of growth units (most probable number of aerobic organisms in the inoculum)
- N = total number of grid-cells on the HGMF (usually 1600)
- x = number of grid-cells showing growth (the HGMF score)
- logₑ = natural logarithm
With the usual N of 1600, the equation becomes:
MPNGU = 1600 logₑ(1600/(1600 − x))
The source document also provides a Conversion Table that reads MPNGU directly from the HGMF score x (scores 1 to 1599); the table is used only for HGMFs holding 1600 grid-cells.
Worked examples (inoculation with 1.0 mL of a 1 in 10 dilution):
- Example 1 — positive grid-cell counts on the duplicate HGMFs: 157 and 164
- MPNGU of filter 1 = 165; MPNGU of filter 2 = 173
- Average MPNGU = 169
- Organisms/mL = average MPNGU × dilution factor = 169 × 10 = 1690, reported as 1700
- Example 2 — positive grid-cell counts from 8 rows on the duplicate HGMFs: 157 and 164
- Score for filter 1 (157 × 5) = 785; score for filter 2 (164 × 5) = 820
- MPNGU of filter 1 = 1079; MPNGU of filter 2 = 1150
- Average MPNGU = 1114
- Organisms/mL = 1100
- Example 3 — negative grid-cell counts from 8 rows on the duplicate HGMFs: 57 and 49 (inoculated with 1.0 mL)
- Score for filter 1 (1600 − (5 × 57)) = 1315; score for filter 2 (1600 − (5 × 49)) = 1355
- MPNGU of filter 1 = 2760; MPNGU of filter 2 = 3002
- Average MPNGU = 2881
- Organisms/mL = 2900
5. Precautions
- HGMFs with fewer than 20 or more than 1520 occupied grid-cells give estimated counts only, because of the greater uncertainty.
- Never average the duplicate filters’ scores and then convert; convert each filter’s score to MPNGU first, then average the MPNGU values.
- The Conversion Table must not be used for HGMFs with a number of grid-cells other than 1600.
References
Health Canada, Compendium of Analytical Methods, Volume 1 — Appendix C, May 2014: “Calculating the Most Probable Number of Growth Units for Hydrophobic Grid-Membrane Filter (HGMF) Methods.”
Sharpe, A.N. and P.I. Peterkin. 1988. Membrane filter food microbiology. Research Studies Press. Taunton, Somerset, U.K.